STAR CANDLE
A star candle stick is a type of chart pattern that appears in financial charts, particularly in candlestick charts. It is a bullish reversal pattern that consists of a large candlestick with a small candlestick gapping above or below it. The large candlestick represents indecision or uncertainty in the market, while the small candlestick represents a trend reversal.
The star candle stick pattern can be bullish or bearish depending on the direction of the small candlestick. If the small candlestick is gapping up above the large candlestick, it is a bullish star candle stick pattern, indicating a potential uptrend. If the small candlestick is gapping down below the large candlestick, it is a bearish star candle stick pattern, indicating a potential downtrend.
It is important to note that the star candle stick pattern is just one of many technical analysis tools and should not be used in isolation to make investment decisions. It is best to use it in conjunction with other technical and fundamental analysis techniques to get a more complete picture of market conditions.

MORNING STAR –
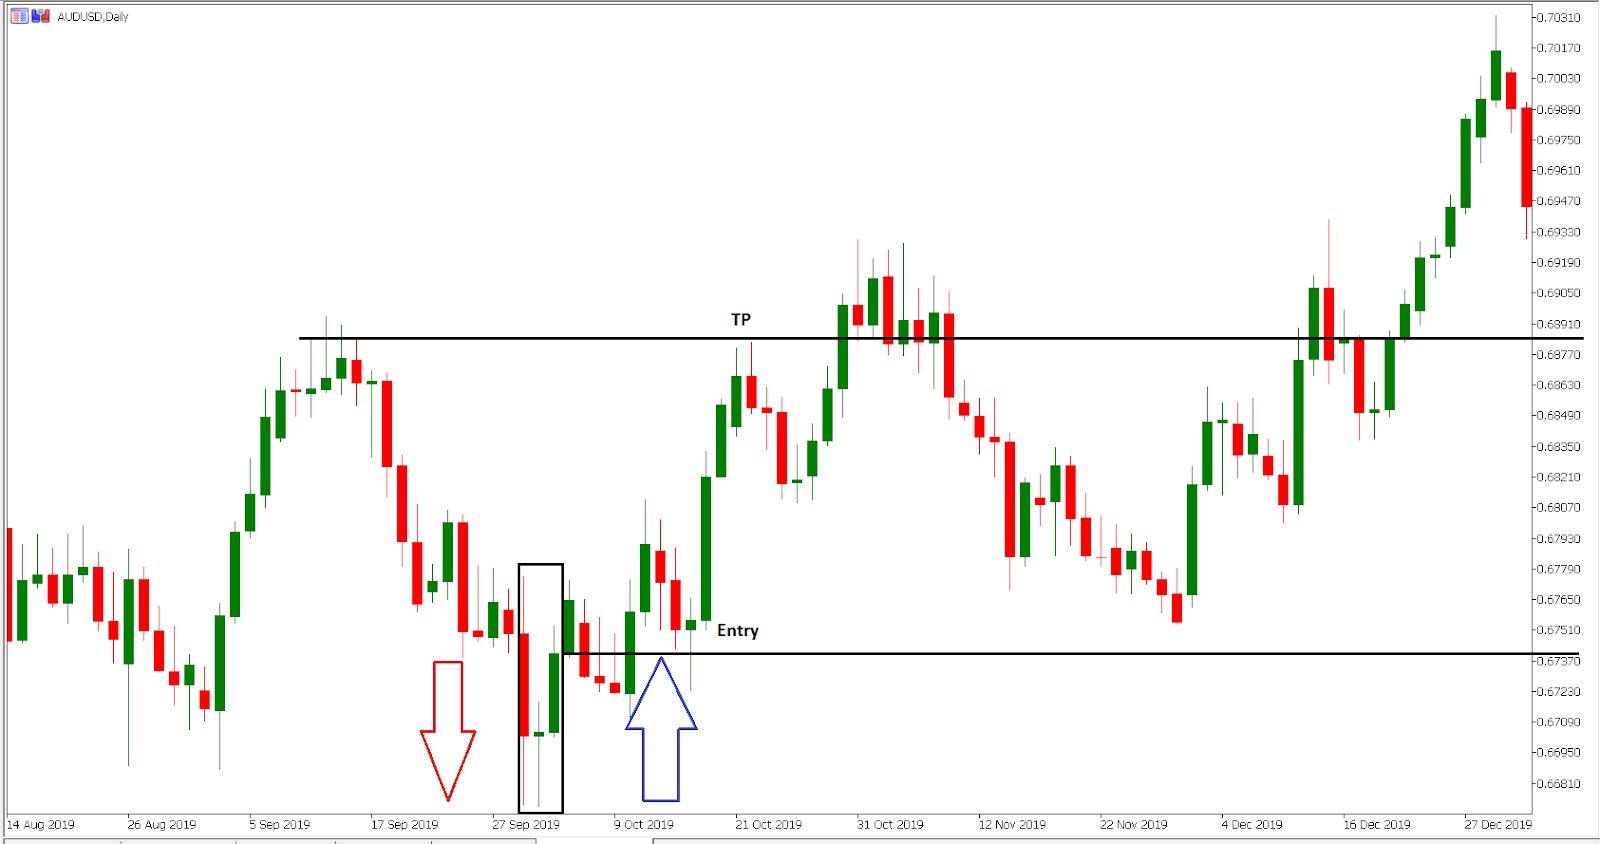
A morning star candle stick pattern is a bullish reversal pattern that appears in financial charts, particularly in candlestick charts. It consists of three candlesticks: a long, bearish candlestick, a small, bullish candlestick, and a long, bullish candlestick. The pattern is called a “morning star” because it is thought to signal the end of a downtrend and the beginning of an uptrend.
The first candlestick in the pattern, the long, bearish candlestick, represents a downtrend. The small, bullish candlestick that follows represents indecision or a pause in the downtrend. The long, bullish candlestick that follows the small candlestick represents a reversal of the downtrend and the beginning of an uptrend.
It is important to note that the morning star candle stick pattern is just one of many technical analysis tools and should not be used in isolation to make investment decisions. It is best to use it in conjunction with other technical and fundamental analysis techniques to get a more complete picture of market conditions.
EVENING STAR –
An evening star candle stick pattern is a bearish reversal pattern that appears in financial charts, particularly in candlestick charts. It consists of three candlesticks: a long, bullish candlestick, a small, bearish candlestick, and a long, bearish candlestick. The pattern is called an “evening star” because it is thought to signal the end of an uptrend and the beginning of a downtrend.
The first candlestick in the pattern, the long, bullish candlestick, represents an uptrend. The small, bearish candlestick that follows represents indecision or a pause in the uptrend. The long, bearish candlestick that follows the small candlestick represents a reversal of the uptrend and the beginning of a downtrend.
It is important to note that the evening star candle stick pattern is just one of many technical analysis tools and should not be used in isolation to make investment decisions. It is best to use it in conjunction with other technical and fundamental analysis techniques to get a more complete picture of market conditions.

SHOOTING STAR –
A shooting star candle stick pattern is a bearish reversal pattern that appears in financial charts, particularly in candlestick charts. It consists of a single candlestick with a long upper shadow and a small body, typically with a downward bias. The pattern is called a “shooting star” because it looks like a star with a long tail pointing downward.
The shooting star candle stick pattern typically appears at the top of an uptrend and indicates a potential reversal of the uptrend. The long upper shadow represents a failed attempt by the bulls (buyers) to push the price higher. The small body represents indecision or a pause in the uptrend. The downward bias of the small body suggests that the bears (sellers) may be taking control of the market.
It is important to note that the shooting star candle stick pattern is just one of many technical analysis tools and should not be used in isolation to make investment decisions. It is best to use it in conjunction with other technical and fundamental analysis techniques to get a more complete picture of market conditions.

Leave a comment