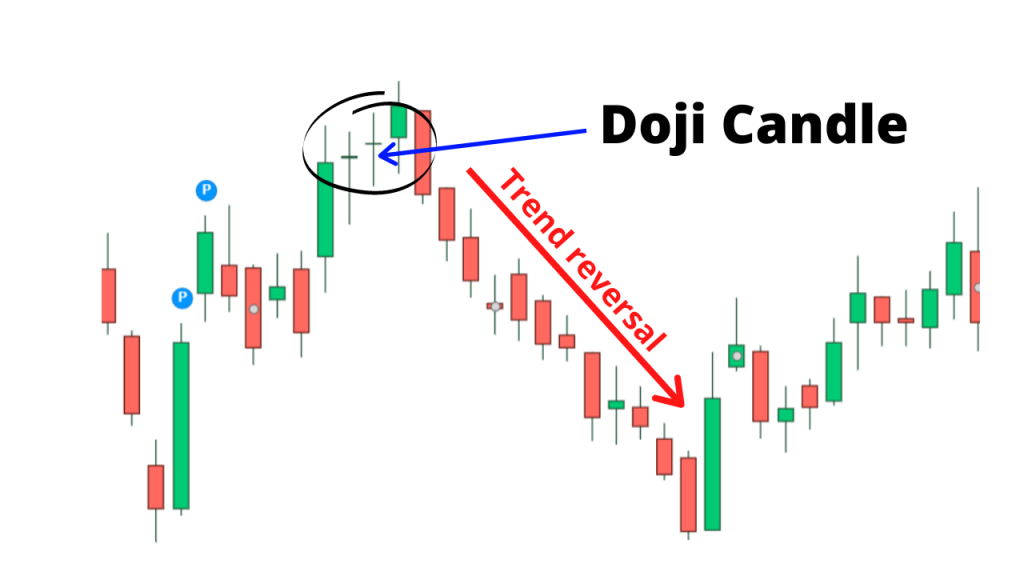
A doji candlestick is a type of chart pattern that is formed when the open and close prices of a security are almost equal. This is represented on a candlestick chart by a small body with long wicks on both ends, giving it a cross-like appearance. A doji candle indicates that the security’s price has fluctuated significantly over the course of the day, but has ended up relatively unchanged.
Doji candlesticks can be seen as neutral patterns, as they do not provide a clear indication of whether buyers or sellers are in control. Instead, they often indicate indecision or uncertainty in the market. As a result, doji candlesticks are often seen as potential reversal patterns, signaling that the security’s price may change direction in the near future.
It is important to note that doji candlesticks should not be interpreted in isolation, but rather in the context of the overall trend and other technical analysis tools and indicators. Technical analysis is just one approach to evaluating securities, and it is important to consider other factors such as fundamental analysis and market conditions when making investment decisions.

Leave a comment