In technical analysis, volume refers to the number of units of a particular asset that are traded over a given period of time. Technical analysts use volume analysis to identify trends and make predictions about future price movements.
There are several ways to use volume in technical analysis, including:
-
Identifying trends: An increase in volume can be a sign of increased interest in an asset and may indicate a trend in the making. A decrease in volume can indicate a lack of interest and may indicate that a trend is losing steam.
-
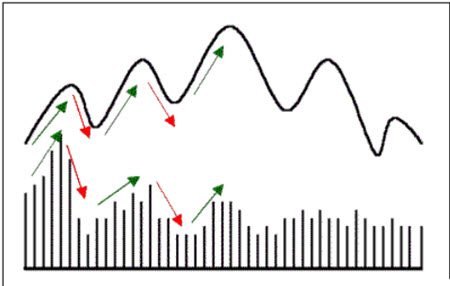
Confirming trends: When volume increases along with the price of an asset, it can be a sign that the trend is gaining strength. Conversely, when volume decreases as the price rises, it can be a sign that the trend is losing strength.
-
Identifying reversals: A sudden increase in volume can be a sign of a reversal in the trend. For example, if the price of an asset has been steadily rising, but there is a sudden increase in volume as the price starts to fall, it could be a sign that the trend is reversing.
-
Setting stop-loss orders: Technical analysts may use volume data to set stop-loss orders, which are orders to sell an asset if it falls below a certain price. For example, if the volume of an asset suddenly increases as the price starts to fall, a technical analyst may set a stop-loss order to sell the asset if the price falls below a certain level.
Volume analysis is just one tool in the technical analyst’s toolkit, and it should be used in conjunction with other techniques, such as trend analysis and support and resistance analysis, to make informed predictions about price movements in the market.

Leave a comment