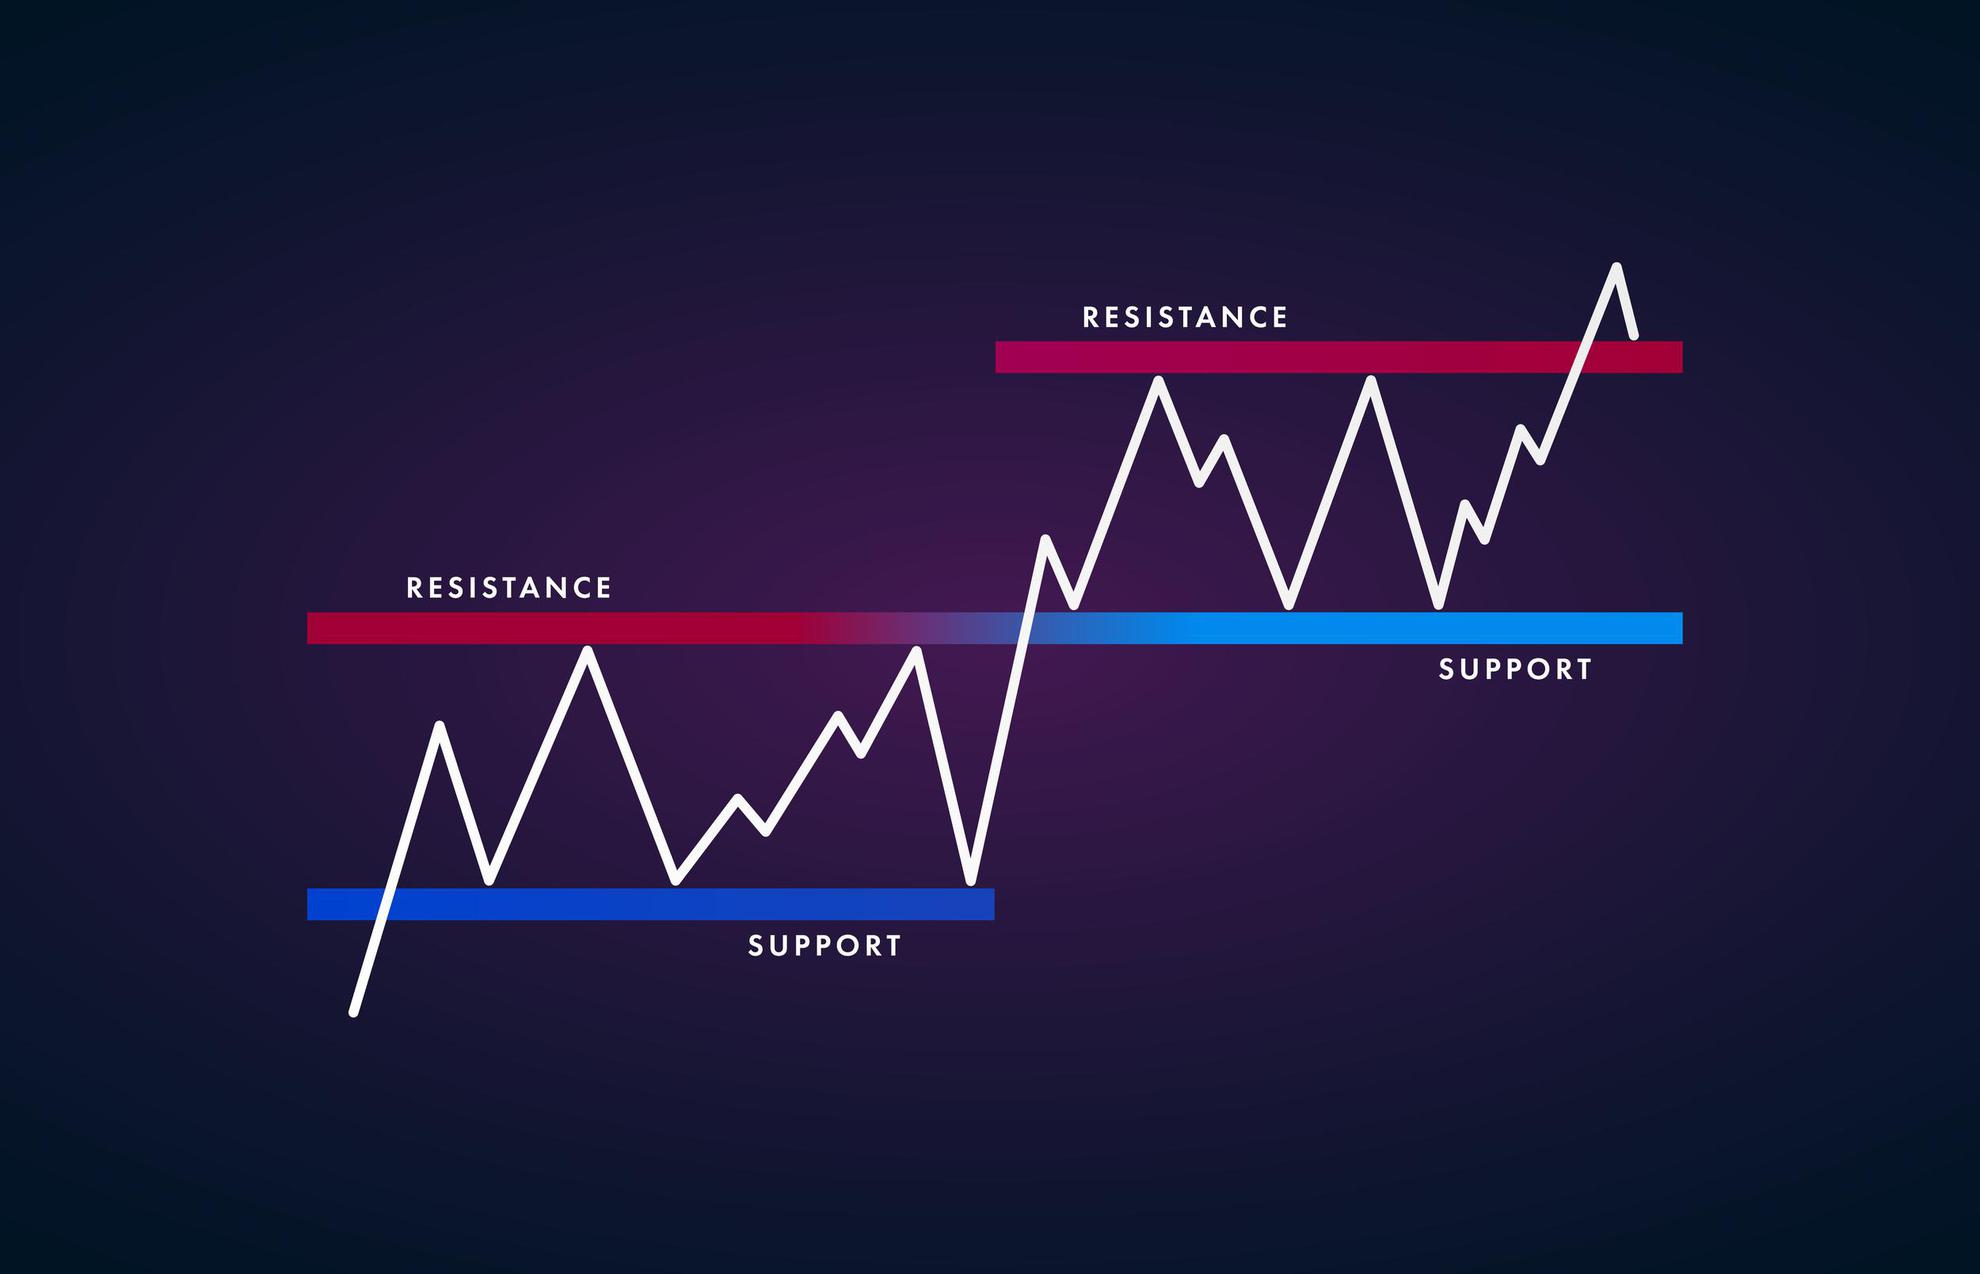
In technical analysis, support and resistance refer to levels on a price chart where the price of an asset has a tendency to stop falling (support) or rising (resistance). These levels can be identified by looking for price patterns or areas where there is a significant amount of buying or selling activity.
Support levels are areas where the price of an asset has a tendency to find support and bounce back up. This can happen because there is a large number of buyers at that price level, or because the price has reached a level where it is considered to be undervalued.
Resistance levels are areas where the price of an asset has a tendency to find resistance and bounce back down. This can happen because there is a large number of sellers at that price level, or because the price has reached a level where it is considered to be overvalued.
Technical analysts use support and resistance levels to make predictions about future price movements. They may look for patterns in the way that the price interacts with these levels, such as a pattern of the price bouncing off a support level and then rising. They may also use these levels to set stop-loss orders or to determine when to enter or exit a trade.
Support and resistance levels are just one tool in the technical analyst’s toolkit, and they should be used in conjunction with other techniques, such as trend analysis and volume analysis, to make informed predictions about price movements in the market.

Leave a comment